


Holidays politicized, researcher finds
Families who voted differently spent less time together
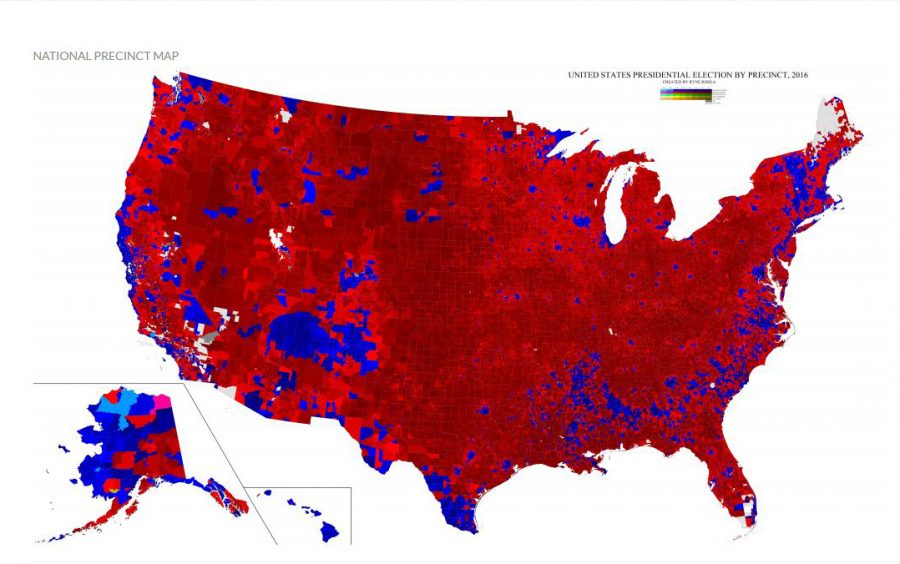
A map showing political affiliation down to the neighborhood level.
November 17, 2017
Republican voters were more likely to cut gatherings with Democratic family members short than the other way around, and the more saturated an area was with political advertising, the shorter family gatherings were, a WSU economics doctoral candidate found.
Ryne Rohla co-authored a paper with M. Keith Chen of University of California, Los Angelos, matching the location data of 10 million smartphones to precinct-level voting data for the 2016 election to better understand how people’s interactions with family members over holiday gatherings may have been affected by the 2016 election results.
The paper compares interactions in households made up of individuals with differing political views versus households with similar political views.
Summing up the findings of their research, Chen and Rohla wrote, “Our results suggest partisan differences cost American families 62 million person-hours of Thanksgiving time.”
Their research found that 56.8 percent of individuals living in Democratic precincts and 43.2 percent from Republican precincts lost time with their families.
Families they identified as having spent 20 and 30 fewer minutes with one another following last years’ election were likely to have voted differently. In comparison to 2015, Democratic voters were about 5 percent less likely than Republicans to travel for Thanksgiving in 2016.
Though Republicans were more likely to travel for Thanksgiving dinner, they were also more likely to leave early: “Travelers from Democratic precincts do not significantly shorten their visits to Republican hosts, while Republican-precinct travelers shortened their visits by over 40 minutes,” the paper found.
“Thanksgiving dinners are further shortened by about 1.5 minutes for every thousand political advertisements aired in the traveler’s home media market,” they found.
Smartphone location-tracking data from a service called Safegraph collected 17 trillion location markers from 10 million cellphones, allowing the researchers to observe actual movement behavior.
This data was used to pinpoint where people usually were between the hours of 1 and 4 a.m., which they then identified as individuals’ home locations. The location data of individuals from 1 p.m. to 5 p.m. on Thanksgiving Day let them know whether or not individuals traveled for dinner, where they went and how long they stayed.
To approximate political views, Chen and Rohla identified individuals who voted for Democratic candidate Hillary Clinton as Democrats and those who voted for President Donald Trump as Republicans. They verified this approximation against state and national data.
“At a national level, the data add up to a Democratic vote share of 50.3 percent, compared to the actual share of 51.1 percent,” they wrote.
While both facetious and serious articles about navigating political conversations with family members over Thanksgiving dinner were not uncommon last year, the study sought to take a more comprehensive look at family interactions throughout the country, according to the paper’s thesis.
Rohla compiled voting data of over 175,000 precincts across the country, and said he worked on his own time to create the first data set of its kind.
Without additional aid or funding, he created what many researchers have called the most comprehensive map of localized voting results of the 2016 elections. When the map was released earlier this year, it was so popular it crashed website servers an hour after posting, he said during an interview this spring.
Rohla said several organizations and individual researchers have approached Rohla for the data, and he is using this data in another one of his doctoral papers at WSU as well.